EPIA Benchmarks - Setup
Details
To keep results as consistent as possible,
we did a fresh install of Windows XP SP1 onto a Maxtor 60GB
HDD inside a Chyang Fun E-Note case with a Samsung Combo DVD/CDRW
drive. Each board was placed inside the machine and tested
in turn. The BIOS of all boards was updated to 1.0F for the
EPIA Ms and 207 for the classic EPIAs. EPIA M drivers were
installed, and when it was their turn to be tested, the XP
"rollback" feature was used to install classic EPIA
drivers to prevent conflicts. The validity of this method
was confirmed by benchmarking another EPIA 800 we had installed
previously. Various sticks of memory and BIOS memory settings
were tried, and the best results chose for each benchmark.
Many tests were conducted multiple times, to ensure accuracy.
One 256MB PC133 DIMM was used for the classic EPIAs, and a
256MB PC2100 DDR DIMM was used for the EPIA Ms.
Sisoft Sandra Benchmarks
Sisoft's
Sandra is a comprehensive diagnostic, analysis and testing
package. We tested the most relevant benchmark modules using
the Standard 2003/SP1 version 9.44 on all 6 machines. Benchmarks
do not always represent a true real-life performance, but
they are useful to compare the speed of various CPUs, and
elements of the system.
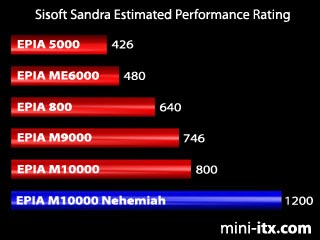
Estimated Performance Rating
Sandra can quickly estimate a performance
rating for a system, based on various factors such as CPU
speed, RAM size etc. We were interested to see what numbers
it came up with, and how they would translate to real world
usage later on in our tests. The Nehemiah scored very highly
in comparison to the Ezra-T M10000. Perhaps the full speed
FPU was to Sandra's liking.
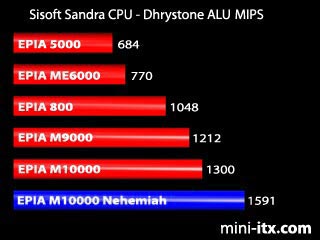
CPU Benchmark
The Dhrystone benchmark is a long standing
industry benchmark used to measure CPU performance using a
standardised sampled of mainly numerical operations. The result
is given in MIPS (Million Instructions Per Second). All boards
produced approximately 1.3 MIPS per 1 MHz of CPU speed - apart
from the Nehemiah, which attained 1.6 MIPS per MHz. This is
clearly an improvement, and shows the Nehemiah to be more
efficient than the earlier Ezra-T core.
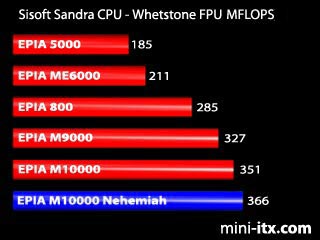
The Whetstone benchmark measures FPU (Floating
Point) performance, although many modern processors have a
number of newer features such as out-of-order execution, pipelining
and SSE2 which are not tested using this benchmark. Perhaps
due to the benchmark's age, the full speed FPU of the Nehemiah
failed to make an impact on this benchmark. All results were
approximately 0.35 MFLOPS per 1 MHz of CPU.
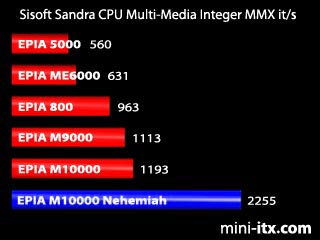
CPU Multi-Media Benchmark
The CPU Multi-Media Benchmark uses all the
Multimedia Extensions available to the CPU to draw a Mandelbrot
fractal. Multimedia Extensions are additions to the x86 instruction
set designed to make repeated or parallel operations run faster.
Digital imaging or streaming video applications can make good
use of these extensions, which use Single Instruction Multiple
Data (SIMD) techniques. Changing the contrast of an image
or MPEG decoding and encoding all require a large amount of
data to be manipulated by the same instructions. This benchmark
is therefore a good test of raw PVR (Personal Video Recorder)
and MPEG2 playback functionality.
The Nehemiah has SSE (Streaming SIMD Extension)
support, which was Intel's answer to AMD's 3DNow!, the first
extensions with floating point support. All the other EPIAs
use the Ezra-T core, which supports 3DNow! This is the most
impressive Nehemiah benchmark - clearly demonstrating the
superiority of the Nehemiah core, and boding well for our
later DVD playback tests.
Historical Note: Intel subsequently released
SSE2 in retaliation to an AMD 3DNow! Enhanced broadside,
which added further SIMD instructions, but support is limited.
Graphics cards have developed at an unheard of pace since
the Intel released MMX, and now directly support DirectX in
hardware. The networking, audio and video functionality that
was supposed to be taken over by today's CPUs hasn't happened.
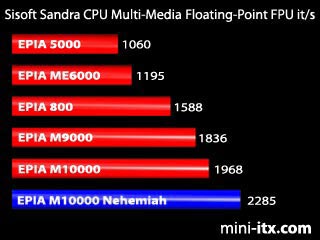
The Floating-Point improvements were not so
marked as the Integer results, but were still respectable.
Real world results will therefore depend on the particular
SIMD instructions used by a particular task.
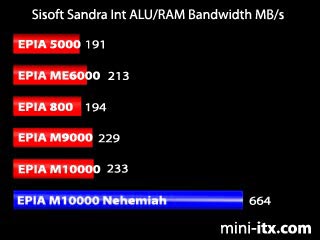
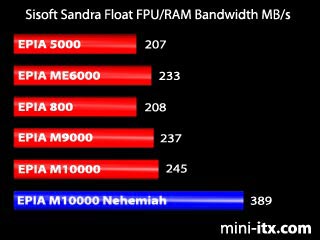
Memory Benchmark
Sandra's Memory Benchmark creates several
large arrays in memory and performs simple memory-bound arithmetic
computations on them - thus reading and writing memory broadly
independent of the CPU. It is slightly more objective than
simply reading and writing to a large block of memory. In
this test the maximum memory bandwidth of the Nehemiah is
1.06 GB/sec, due to its 133 MHz bus frequency and 64bit single
data rate processor interface.
As we were testing with only 2 sticks of memory
(one PC133, one PC2100 DDR), we expected to get similar but
slightly faster results for the Ms than for the classic EPIAs.
This is exactly what we got - apart from the Nehemiah, which
excelled at the test (we ran it a couple more times to make
sure). The Nehemiah was squeezing a lot more of the available
bandwidth out of the memory.
PCMark 2002
-->